|
I've just discovered the GraphViz package from AT&T Research. I have heard of the package before. It was a release of pydot, a Python wrapper, that got me to look at it.
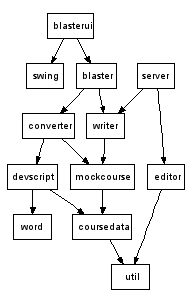
GraphViz makes it astonishingly simple to create nice-looking graphics. For example, to make a package dependency graph of the Java packages in Meccano, I created this graph definition:
digraph G {
  size = "3,3";
  node [shape=box,fontname="Helvetica"];
  blasterui -> blaster;
  blasterui -> swing;
  blaster -> converter;
  blaster -> writer;
  writer -> mockcourse;
  devscript -> coursedata;
  devscript -> word;
  converter -> devscript;
  converter -> mockcourse;
  mockcourse -> coursedata;
  coursedata -> util;
  server -> editor;
  server -> writer;
  editor -> util;
}
I saved the definition in a file called dep.data. Next I ran dot from the command line with
dot -Tpng dep.data > dep.png
Here is the resulting image:

There is much, much more you can do with this package but this shows how easy it is to get a useful result.
pydot puts a Python wrapper around GraphViz. This could be useful for creating graphs from a program. For hand-created graphs it might be easier just to write the data file by hand as I did for the example.
I had to make a few changes to pydot.py to get it to work under Windows. There were problems with the PATH separator, the name of the .exe files, and text vs binary files. Here is a diff from version 0.9 that shows the changes I made:
Compare: (<)C:\Downloads\Python\pydot-0.9\pydot.py (26989 bytes)
   with: (>)C:\Python23\Lib\site-packages\pydot.py (27121 bytes)

117c117
<     for path in os.environ['PATH'].split(':'):
---
>     for path in os.environ['PATH'].split(os.pathsep):
121a121,122
>             elif os.path.exists(path+os.path.sep+prg + '.exe'):
>                 progs[prg]=path+os.path.sep+prg + '.exe'
727c729
<         dot_fd=open(path, "w+")
---
>         dot_fd=open(path, "w+b")
763c765
<         out=os.popen(self.progs[prog]+' -T'+format+' '+tmp_name, 'r')
---
>         out=os.popen(self.progs[prog]+' -T'+format+' '+tmp_name, 'rb')
|